The Guide to SRE Principles


Site reliability engineering (SRE) is a discipline in which automated software systems are built to manage the development operations (DevOps) of a product or service. In other words, SRE automates the functions of an operations team via software systems.
The main purpose of SRE is to encourage the deployment and proper maintenance of large-scale systems. In particular, site reliability engineers are responsible for ensuring that a given system’s behavior consistently meets business requirements for performance and availability.
Furthermore, whereas traditional operations teams and development teams often have opposing incentives, site reliability engineers are able to align incentives so that both feature development and reliability are promoted simultaneously.
Basic SRE principles
In this article, we’ll cover key principles that underlie SRE, provide some examples of those key principles, and include relevant details and illustrations to clarify these examples.
| Principle | Description | Example |
| Embrace risk | No system can be expected to have perfect performance. It’s important to identify potential failure points and create mitigation plans. Additionally, it’s important to budget a certain percentage of business costs to address these failures in real time. | A week consists of 168 hours of potential availability. The business sets an expectation of 165 hours of uptime per week to account for both planned maintenance and unplanned failures. |
| Set service level objectives (SLOs) | Set reasonable expectations for system performance to ensure that customers and internal stakeholders understand how the system is supposed to perform at various levels. Remember that no system can be expected to have perfect performance. | The website is up and running 99% of the time.99% of all API requests return a successful response.The server output matches client expectations 99% of the time.99% of all API requests are delivered within one second.The server can handle 10,000 requests per second. |
| Eliminate work through automation | Automate as many tasks and processes as possible. Engineers should focus on developing new features and enhancing existing systems at least as often as addressing real-time failures. | Production code automatically generates alerts whenever an SLO is violated. The automated alerts send tickets to the appropriate incident response team with relevant playbooks to take action. |
| Monitor systems | Use tools, such as Squadcast, to monitor system performance. Observe performance, incidents, and trends. | A dashboard that displays the proportion of client requests and server responses that were delivered successfully in a given time period.A set of logs that displays the expected and actual output of client requests and server responses in a given time period. |
| Keep things simple | Release frequent, small changes that can be easily reverted to minimize production bugs. Delete unnecessary code instead of keeping it for potential future use. The more code and systems that are introduced, the more complexity created; it’s important to prevent accidental bloat. | Changes in code are always pushed via a version control system that tracks code writers, approvers, and previous states. |
| Outline the release engineering process | Document your established processes for development, testing, automation, deployments, and production support. Ensure that the process is accessible and visible. | A published playbook lists the steps to address reboot failure. The playbook contains references to relevant SLOs, dashboards, previous tickets, sections of the codebase, and contact information for the incident response team. |
Embrace risk
No system can be expected to have perfect performance. It’s important to create reasonable expectations about system performance for both internal stakeholders and external users.
Key metrics
For services that are directly user-facing, such as static websites and streaming, two common and important ways to measure performance are time availability and aggregate availability.
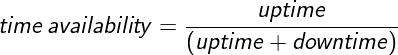

This article provides an example of calculating time availability for a service.
For other services, additional factors are important, including speed (latency), accuracy (correctness), and volume (throughput).


An example calculation for latency is as follows:
Suppose 10 different users serve up identical HTTP requests to your website, and they are all served properly.
The return times are monitored and recorded as follows: 1 ms, 3 ms, 3 ms, 4 ms, 1 ms, 1 ms, 1 ms, 5 ms, 3 ms, and 2 ms.
The average response time, or latency, is 24 ms / 10 returns = 2.4 ms.
Choosing key metrics makes explicit how the performance of a service is evaluated, and therefore what factors pose a risk to service health. In the above example, identifying latency as a key metric indicates average return time as an essential property of the service. Thus, a risk to the reliability of the service is “slowness” or low latency.
Define failure
In addition to measuring risks, it’s important to clearly define which risks the system can tolerate without compromising quality and which risks must be addressed to ensure quality.
This article provides an example of two types of measurements that address failure: mean time to failure (MTTF) and mean time between failures (MTBF).
The most robust way to define failures is to set SLOs, monitor your services for violations in SLOs, and create alerts and processes for fixing violations. These are discussed in the following sections.
Error budgets
The development of new production features always introduces new potential risks and failures; aiming for a 100% risk-free service is unrealistic. The way to align the competing incentives of pushing development and maintaining reliability is through error budgets.
An error budget provides a clear metric that allows a certain proportion of failure from new releases in a given planning cycle. If the number or length of failures exceeds the error budget, no new releases may occur until a new planning period begins.
The following is an example error budget.
Planning cycle | Quarter |
Total possible availability | 2,190 hours |
SLO | 99.9% time availability |
Error budget | 0.1% time availability = 21.9 hours |
Suppose the development team plans to release 10 new features during the quarter, and the following occurs:
The first feature doesn’t cause any downtime.
The second feature causes downtime of 10 hours until fixed.
The third and fourth features each cause downtime of 6 hours until fixed.
At this point, the error budget for the quarter has been exceeded (10 + 6 + 6 = 22 > 21.9), so the fifth feature cannot be released.
In this way, the error budget has ensured an acceptable feature release velocity while not compromising reliability or degrading user experience.
Set service level objectives (SLOs)
The best way to set performance expectations is to set specific targets for different system risks. These targets are called service level objectives, or SLOs. The following table lists examples of SLOs based on different risk measurements.
Time availability | Website running 99% of the time |
Aggregate availability | 99% of user requests processed |
Latency | 1 ms average response rate per request |
Throughput | 10,000 requests handled every second |
Correctness | 99% of database reads accurate |
Depending on the service, some SLOs may be more complicated than just a single number. For example, a database may exhibit 99.9% correctness on reads but have the 0.1% of errors it incurs always be related to the most recent data. If a customer relies heavily on data recorded in the past 24 hours, then the service is not reliable. In this case, it makes sense to create a tiered SLO based on the customer’s needs. Here is an example:
Level 1 (records within the last 24 hours) | 99.99% read accuracy |
Level 2 (records within the last 7 days) | 99.9% read accuracy |
Level 3 (records within the last 30 days) | 99% read accuracy |
Level 4 (records within the last 6 months) | 95% read accuracy |
Costs of improvement
One of the main purposes of establishing SLOs is to track how reliability affects revenue. Revisiting the sample error budget from the section above, suppose there is a projected service revenue of $500,000 for the quarter. This can be used to translate the SLO and error budget into real dollars. Thus, SLOs are also a way to measure objectives that are indirectly related to system performance.
| SLO | Error Budget | Revenue Lost |
| 95% | 5% | $25,000 |
| 99% | 1% | $5,000 |
| 99.90% | 0.10% | $500 |
| 99.99% | 0.01% | $50 |
Using SLOs to track indirect metrics, such as revenue, allows one to assess the cost for improving a service. In this case, spending $10,000 on improving the SLO from 95% to 99% is a worthwhile business decision. On the other hand, spending $10,000 on improving the SLO from 99% to 99.9% is not.
quent changes using version control and code reviews.